Spring 2026 Market Update
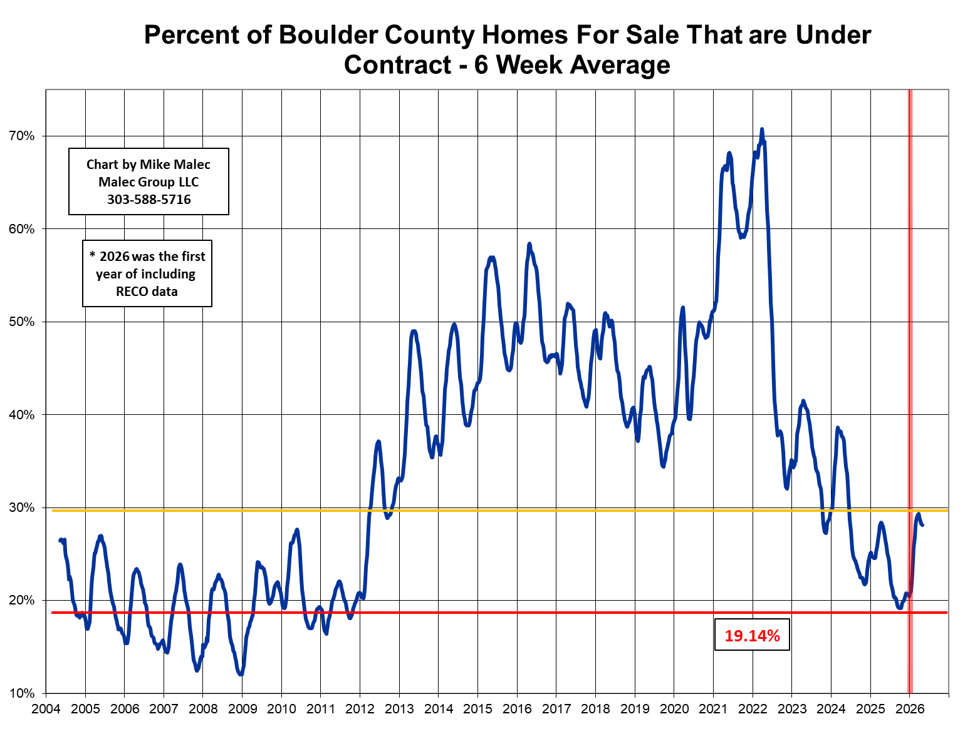
I’m hearing lots of bewilderment out there right now in the local Boulder County market. Some people are experiencing strong market activity and many others are wondering what’s going on. To make matters more difficult, with the inclusion of RECO data this year, I can’t do many of my year to year comparisons without a big asterisk. Some of my metrics, however, are ratios which should give a better sense of market activity with the inclusion of the additional RECO data. Here’s my chart tracking the percentage of Boulder County single family and attached homes that are under contract. We appear to have already hit the spring high point and are already trending downwards, which would be slightly earlier than the last several years. If this is the peak in the percent under contract for the year, we never reached the 35% level that typically signals home price appreciation. Assuming the ratio handles the additional RECO data without distortions, we did hit a higher peak in percentage under contract this year than last year. This is surprising for reasons I’ll detail below.
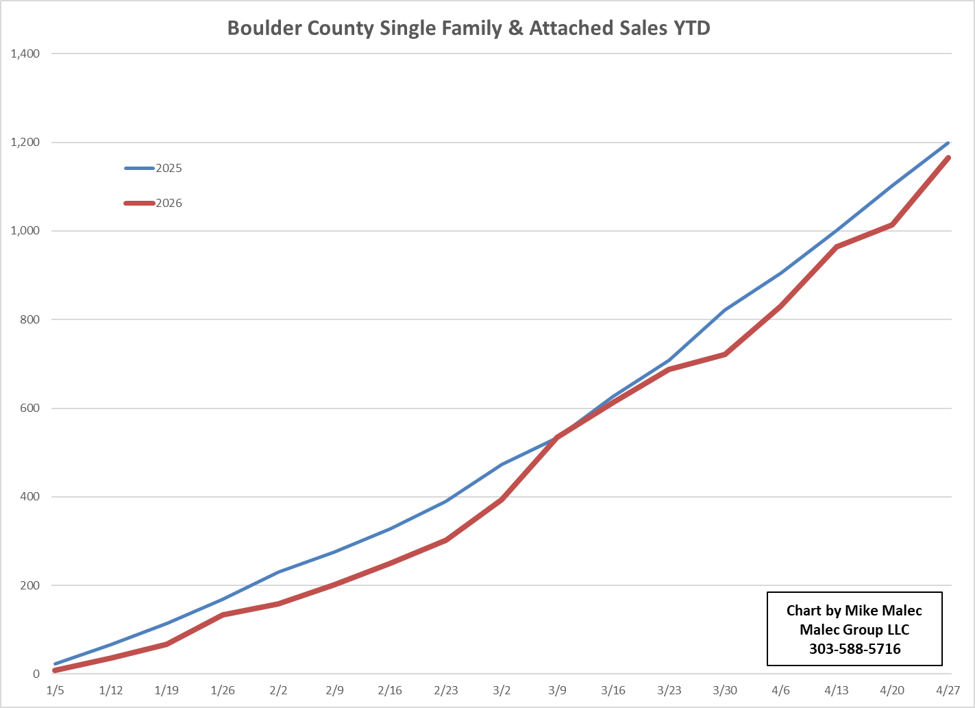
With a year over year comparison of the number of homes available and under contract misleading due to the RECO data changes, I’m not going to provide the chart I typically do at this time of the year. I can look at sales however and retroactively include the RECO data into the sales numbers. When I look at those sales, 2025 versus 2026, we are trending slightly below last year’s numbers, which is odd as we were at a higher percentage under contract above. So are we stronger than last year or not, that’s the big confusing question. There are several possible reasons why the 2026 sales numbers might be lagging the 2025 sales numbers. One, sales at times don’t get recorded into the MLS as quickly as we would like and its possible that we’re just missing some 2026 sales that haven’t been entered into either MLS system yet. A second possibility, I run my data collection on Mondays, so my data is based on the week of the year. Due to the differing calendar layouts between 2025 and 2026, there has been one more business day through the 18th week of the year in 2025 when compared to 2026. Thirdly, just because we have a higher percentage under contract, that doesn’t automatically turn into more sales. If we were seeing greater cancellation rates between 2025 and 2026, that might be an explanation. I do track this cancellation metric, but also have the RECO data inclusion issue in that tracking data. Below are the 2025 and 2026 sales numbers. 2026 tracking closely, but consistently behind 2025.
If we’re moving through the spring selling season faster than normal and we continue to see shaken consumer confidence, uncertain economic direction and mortgage rates remaining above 6% we could see a stronger than average summer slump. On the other hand, the strength in the market some are feeling, against all apparent odds, leads me to believe we could always be surprised.
Good to finally see some precipitation. Everyone continue your rain dances!