Q4 FHFA HPI update
FHFA’s HPI index is our best source for overall market appreciation data. The dilemma, the data is very delayed. We now have Q4 2025 data, although it would include some sales that went under contract as early as in September 2025. So, we can use this data to see where we’ve been, but the data to show the most recent changes to the market really won’t show up until this fall. So, with those caveats, here is the Q4 FHFA HPI Data.
From the most recent HPI report – U.S. house prices rose 1.8 percent between the fourth quarter of 2024 and the fourth quarter of 2025, according to the U.S. Federal Housing (FHFA) House Price Index (FHFA HPI®). House prices for the fourth quarter of 2025 rose 0.8 percent compared to the third quarter of 2025. FHFA’s seasonally adjusted monthly index for December rose 0.1 percent from November.
Significant Findings
· Nationally, the U.S. housing market has experienced positive annual appreciation each quarter since the start of 2012.
· House prices rose in 41 states between the fourth quarter of 2024 and the fourth quarter of 2025. The five states with the highest annual appreciation were 1) North Dakota, 6.4 percent; 2) Delaware, 6.3 percent; 3) Illinois, 6.1 percent; 4) Wisconsin, 5.7 percent; and 5) Michigan, 5.5 percent. House prices were down in nine states and the District of Columbia. Florida experienced the most significant price decline at 2.7 percent.
· House prices rose in 66 of the 100 largest metropolitan areas over the previous four quarters. The annual price increase was the greatest in Allentown-Bethlehem-Easton, PA-NJ at 8.9 percent. The metropolitan area that experienced the most significant price decline was Cape Coral-Fort Myers, FL at 9.1 percent.
· Six of the nine census divisions had positive house price changes year-over-year. The East North Central division recorded the strongest appreciation, posting a 5.0 percent increase from the fourth quarter of 2024 to the fourth quarter of 2025. The Mountain division recorded a 0.2 percent decline.
· Trends in the Top 100 Metropolitan Statistical Areas are available in our interactive dashboard: https://www.fhfa.gov/DataTools/Tools/Pages/FHFA-HPI-Top-100-Metro-Area-Rankings.aspx. The first tab displays rankings while the second tab offers charts.
Here’s a look at how these numbers played out for the MSA’s in Colorado compared to the 241 other MSA’s across the country (that made this report) and how Colorado compared to the other states plus the District of Columbia. Boulder County remained in 3rd place for appreciation since 1991 across the entire country. The chart below is sorted by the 1-year appreciation rankings. I’m usually surprised by some of the findings in this report and this one didn’t disappoint. I was surprised to see the unusual strength in the Grand Junction MSA over the last 12 months compared to the rest of the state. Also nice to see Boulder outperforming Denver again.
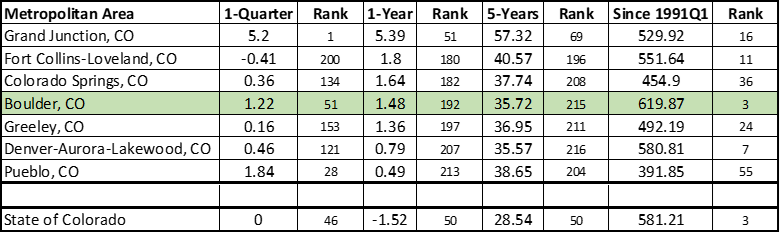
Colorado MSA FHFA HPI Data
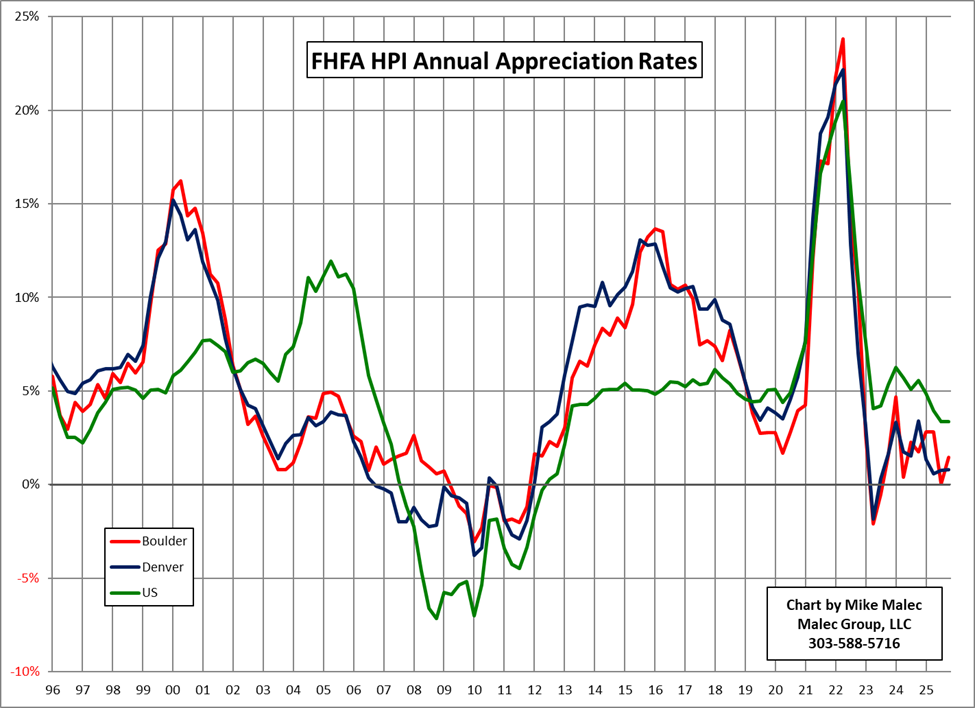
Here is a graph comparing the annual appreciation rates for the Boulder MSA (all of Boulder County), the Denver MSA (the City and County of Denver, Arapahoe County, Jefferson County, Adams County, Douglas County, the City and County of Broomfield, Elbert County, Park County, Clear Creek County, and Gilpin County) and the US. The Boulder and Denver MSAs have been underperforming the national average for a few years now. This is probably correlated with our recent lower in-migration rates as a state.
The national map, color coded by appreciation over the preceding 12 months.
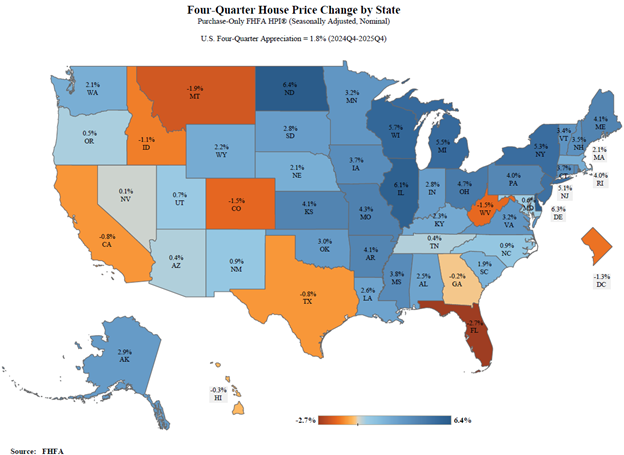
Q4 FHFA HPI Appreciation map
As always, this data is delayed and I think most would agree the next report, not due till May and showing the first numbers from 2026, will be an interesting read, both nationally and locally. Spring is coming, although it feels like summer already. The market has had its typical stronger spring activity and we’ll have to watch and wait to see if that is sustainable.