
Mid-Year look at Buyer Demand
So, with almost half of 2026 in the books, how is the buyer demand holding up compared to previous years?
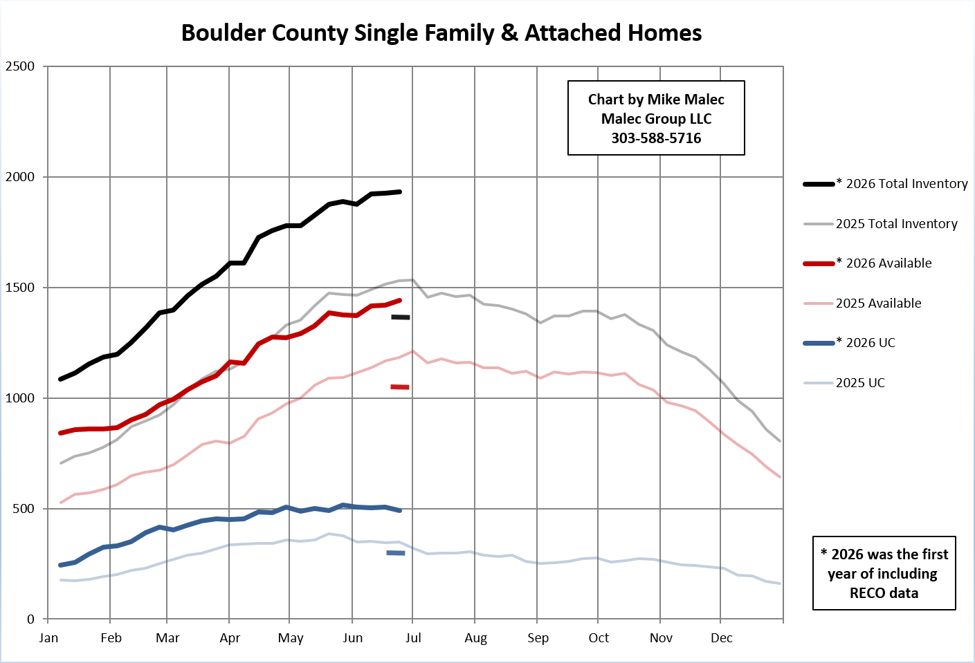
The first chart I wanted to look at shows Available Inventory and our Under Contract numbers compared to 2025. As with most of my data this year, these numbers are skewed by the 2026 inclusion of RECO data and are showing growth in the metrics that I don’t think is real, just an artifact of the new data set. I placed small, color-coded dashes into the chart below that would show the levels if we just used IRES only data. With IRES only data, we’re just below last year’s levels. In a time of so much upheaval on so many levels, I am heartened to see that the data is at least conforming to the typical seasonal pattern. We should see the market round over the top in Total Inventory and Available Inventory shortly. To my eye, it looks as if the Buyer demand has already rounded over the top and the peak was in late May. I was chatting with a colleague who has left the business, and he remarked that he felt as if there was a lack of inventory for sale in the market. I think this is true for the Louisville area he was talking about, especially if you limit yourself to quality inventory. The nice houses out there are still getting snapped up and the leftovers aren’t as appealing.
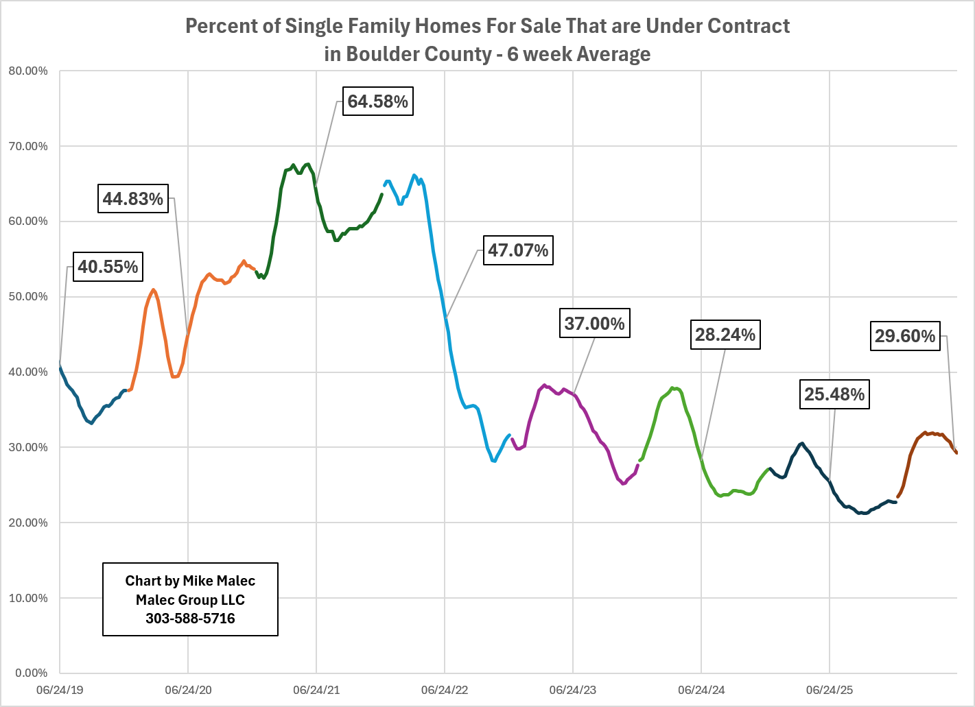
I also updated a chart I created a couple of years ago showing the percentage of single-family homes in Boulder County under contract at this time of the year over the last seven years. The different colors of the chart are the different years and the vertical bars denote this same time each year, the end of June going back to 2019. I’m having a tough time deciphering if the rise in UC Percentage is real or an artifact of the new dataset. I would expect a ratio like this metric to cancel out the dataset differences, but it doesn’t feel to me as if Buyer demand is picking up. On the other hand, 4 percentage points of difference doesn’t signal a sea change across the entire County. I’d expect this metric to continue trending downward for the remainder of the year, which is the typical seasonal pattern.
Hope everyone enjoys their Fourth of July celebrations!