2025 Boulder County Market Review
I’ve downloaded and massaged the year-end numbers and this will be the first of several articles talking about how the 2025 Boulder County real estate market performed. In a big change compared to previous years, I’ve finally felt compelled to include RECO data and combine that with the IRES data. Unfortunately, there is no good answer on whether or which way to do this. By including RECO data, I’m introducing some level of duplicate sales that are not scrubbed by the de-duplication systems within IRES. I think that error in the data is smaller than the data I’m missing by not including RECO. As you can see in the chart below, the number of sales in Boulder County being solely reported in RECO is increasing every year and has reached a level (40% in 2025) that I no longer feel I can exclude in the name of data integrity and the utility of keeping the same methodology for historical comparisons. As usual, this analysis will miss any sales not reported to either MLS system. The percentage column in the chart below is the percentage increase in sales when I used the combined IRES & RECO data compared to just using the IRES data.

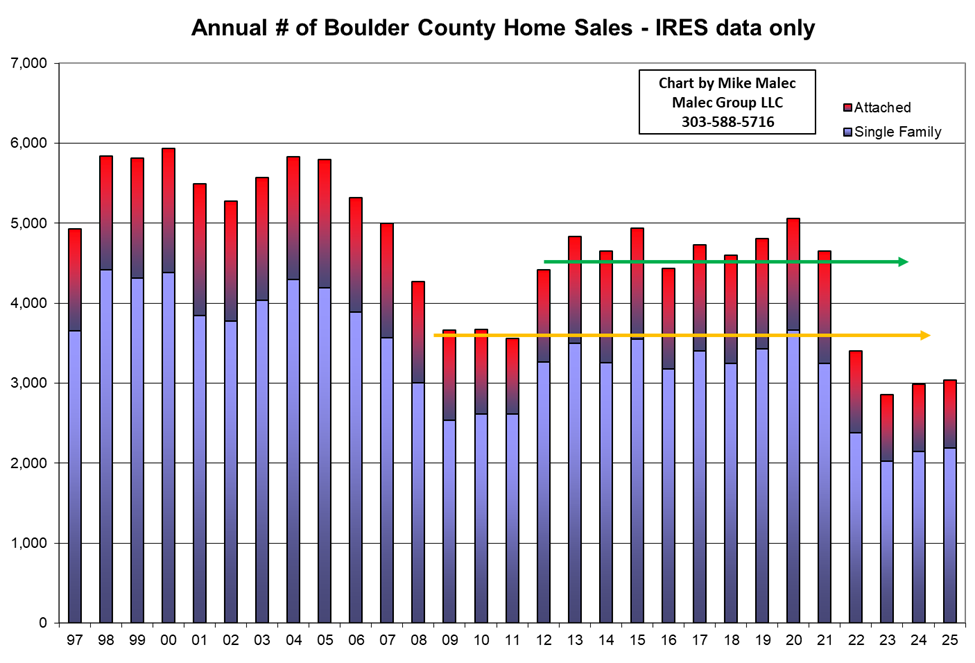
For the third year in a row, the 2025 sales just surpassed the previous year’s numbers and showed 3.1% growth in total sales. Positive growth in detached home sales (4.5%) offset the small negative drop in attached home sales (-0.4%). This year’s small increase marks the third year of increasing sales which hopefully is a trend that will continue in 2026. To stay as consistent as possible in the chart above, I can only go back 5 years to include the RECO data.
The chart at the top of the next page is back to IRES only data to be able to give the “apples to apples” historical perspective going back to 1998. The last three years, 2023, 2024 and 2025, have been the years with the lowest sales totals during that entire period back to 98. Amazingly, our sales in the last 3 years have been below the levels we saw during the Great Recession (yellow horizontal line in the chart). Such low sales numbers are likely to be driving some of the increase in RECO only sales in Boulder County as many brokers are travelling further afield to keep their production levels up. With this drop in sales, you’d think the ranks of licensees in Colorado would be dropping precipitously, but over the last 4 years, we’ve only lost 5% of the licensees at the state level as best as I can determine by keeping track of the state licensee lists since 2023. As of January 10th, 2026, there are 42,118 licensees in the state. No way to tell how many of those licensees are actually practicing brokers versus people who are just keeping their license for the time being.
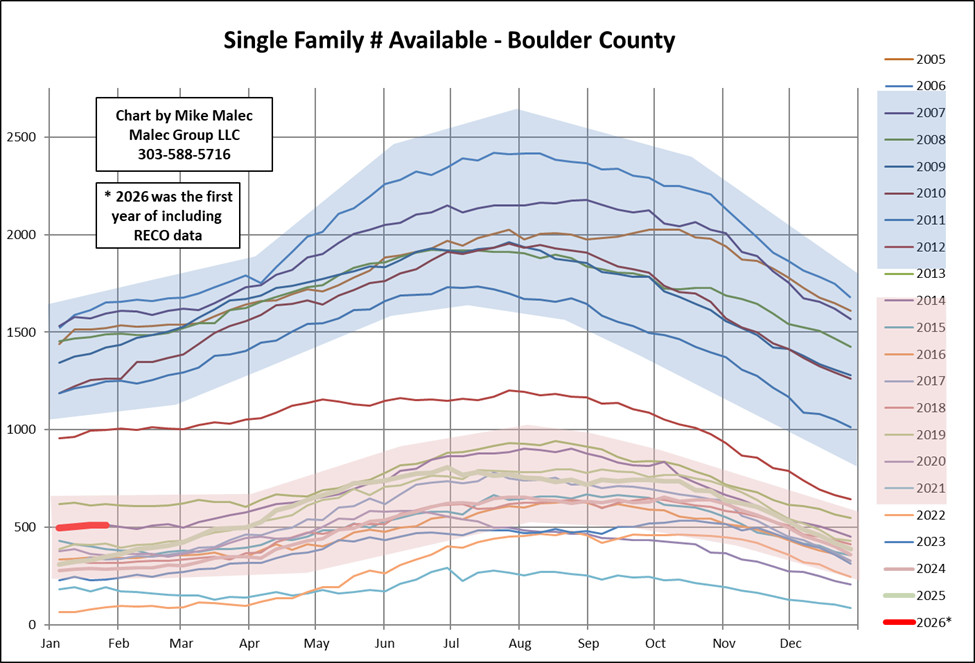
Back to combined IRES & RECO data for a quick look at Available Inventory across Boulder County . This illustrates one of the downsides of including the RECO data. The chart below shows an increase in Inventory. With no way to go back and get old, combined data for the number of Active listings, we’re not left with a way to avoid an asterisk. 2026 will be the first year of combined data on many of my charts. So, the increase in Available Inventory, is that a real increase or just an increase due to the inclusion of RECO data? The best I can tell looking at just IRES numbers for this week is that IRES only inventory is mostly flat, so the increase is just due to the RECO data. That may change in other weeks and as the proportion of data between the two systems ebbs and flows. There are so many variables, too many to track and compare every week, that I have just made the decision to place the asterisk on the chart and move ahead. Even with the greater inventory levels, we’re still within the bounds of normality that we’ve experienced over the last several years, still within the red “new normal” zone we created after the Great Recession really ballooned Boulder County Available Inventory.
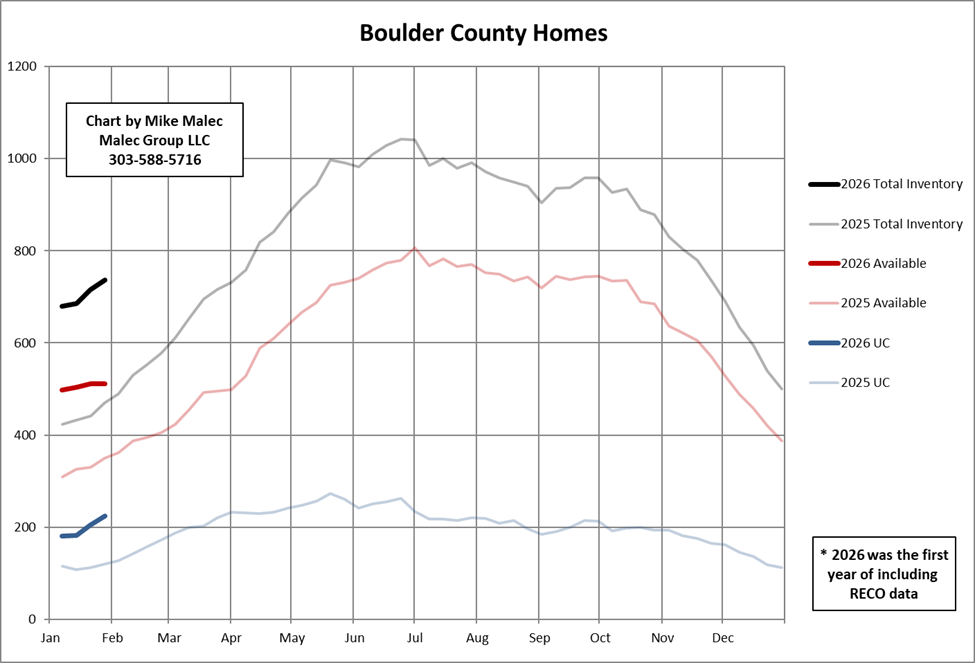
In the next chart, we have the same asterisk, but at least all three metrics are generally the same amount higher than last year’s numbers which I again presume is due to the inclusion of the RECO data. The good news is this is only going to be an issue in this, the transition year. So, inflated levels due to extra data, but generally holding the same patterns as the previous year which also tells me this is an extra data move not a change in the market dynamics. I might be able to see a slight flattening in the number Available and a slight increase in the Under Contract numbers, but will want to wait on a couple more weeks of data before having any confidence in a change. The overall outlook still seems similar to last year to me. Lots of general uncertainty in the world and the economy. Most buyers and sellers “of choice” are hanging on the sidelines, watching and waiting, and typically I’m only talking to people who must make a move due to their personal situation and out of necessity.
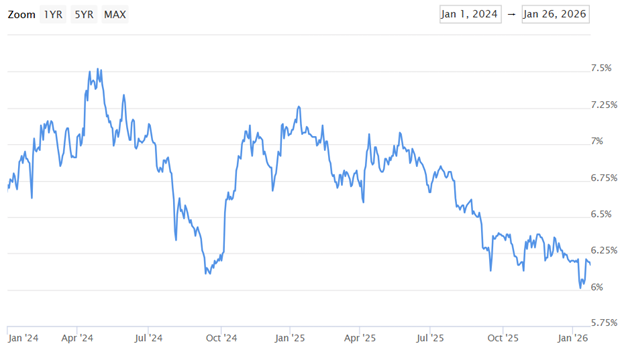
The one metric that looks the best so far this year is mortgage rates. We’ve seen rates for a 30 year fixed mortgage work their way down from 7.25% a year ago to 6.19% as of Jan. 26th, 2026. We saw a brief dip below 6% and lenders got enough refinance business that they chose to raise rates to manage their workloads. Then more economic uncertainty brought rates back above 6%. The interesting story about this drop in rates over the last 12 months is we didn’t necessarily see an associated increase in market activity. My theory is that uncertainty has outweighed rate reduction, but not all market watchers agree. If rates were to move even lower, we might see an increase in market activity, but rates might only move lower if the economic picture worsens, which may outweigh the positive effect of the rate drop. If only everything wasn’t so interconnected and complex! Here is a chart from Mortgage News Daily showing the rate on a 30-year fixed mortgage since Jan. 1st, 2024.
How will 2026 play out for the Boulder County market? I think we have a greater chance of a downside surprise than an upside surprise. Aside from any surprises or national/international factors influencing the local market, I generally think we’ll have a similar year to 2025. Inventory that continues to grow at a modest pace, prices that may drop a touch, but without any seller distress evident in Boulder County, I don’t foresee any large percentage drops in home prices. The biggest unknown to me will be the reaction from buyers. Will a drop in rates be enough to engage buyer interest and increase our Percentages Under Contract and the Number of Homes Under Contract? Those are the metrics I’ll be following closely.
Hope everyone has a fabulous 2026!